By The Barcelona Trader (obviously)
Let’s start with the obvious:
No, I don’t trade from a Gaudí balcony sipping vermut while sardana dancers whisper trade signals in the wind.
And no, the name isn’t about branding.
At least—not the kind you think.
The Barcelona Trader isn’t a costume.
It’s a reflection. A flag. A reclamation.
A City That Shaped Me
I spent some of the most formative years of my life in Barcelona and in a small town to the north called Cardedeu.
It wasn’t just where I lived—it’s where I became me. In fact, by the time I moved back to the U.S. in 2008, I had lived over half of my life there.
I built businesses there.
Launched a Catalan watch brand that went cult-famous.
Ran concerts that brought legends like Prince, Springsteen, and U2 to town.
And I immersed myself in a culture that values art, passion, rebellion, and clarity—all things I still carry into the markets.
Barcelona taught me to see structure in chaos.
To lead with instinct, but back it with discipline.
To understand that sometimes, the best move is a bold one.
Not Just a Memory—Still a Home
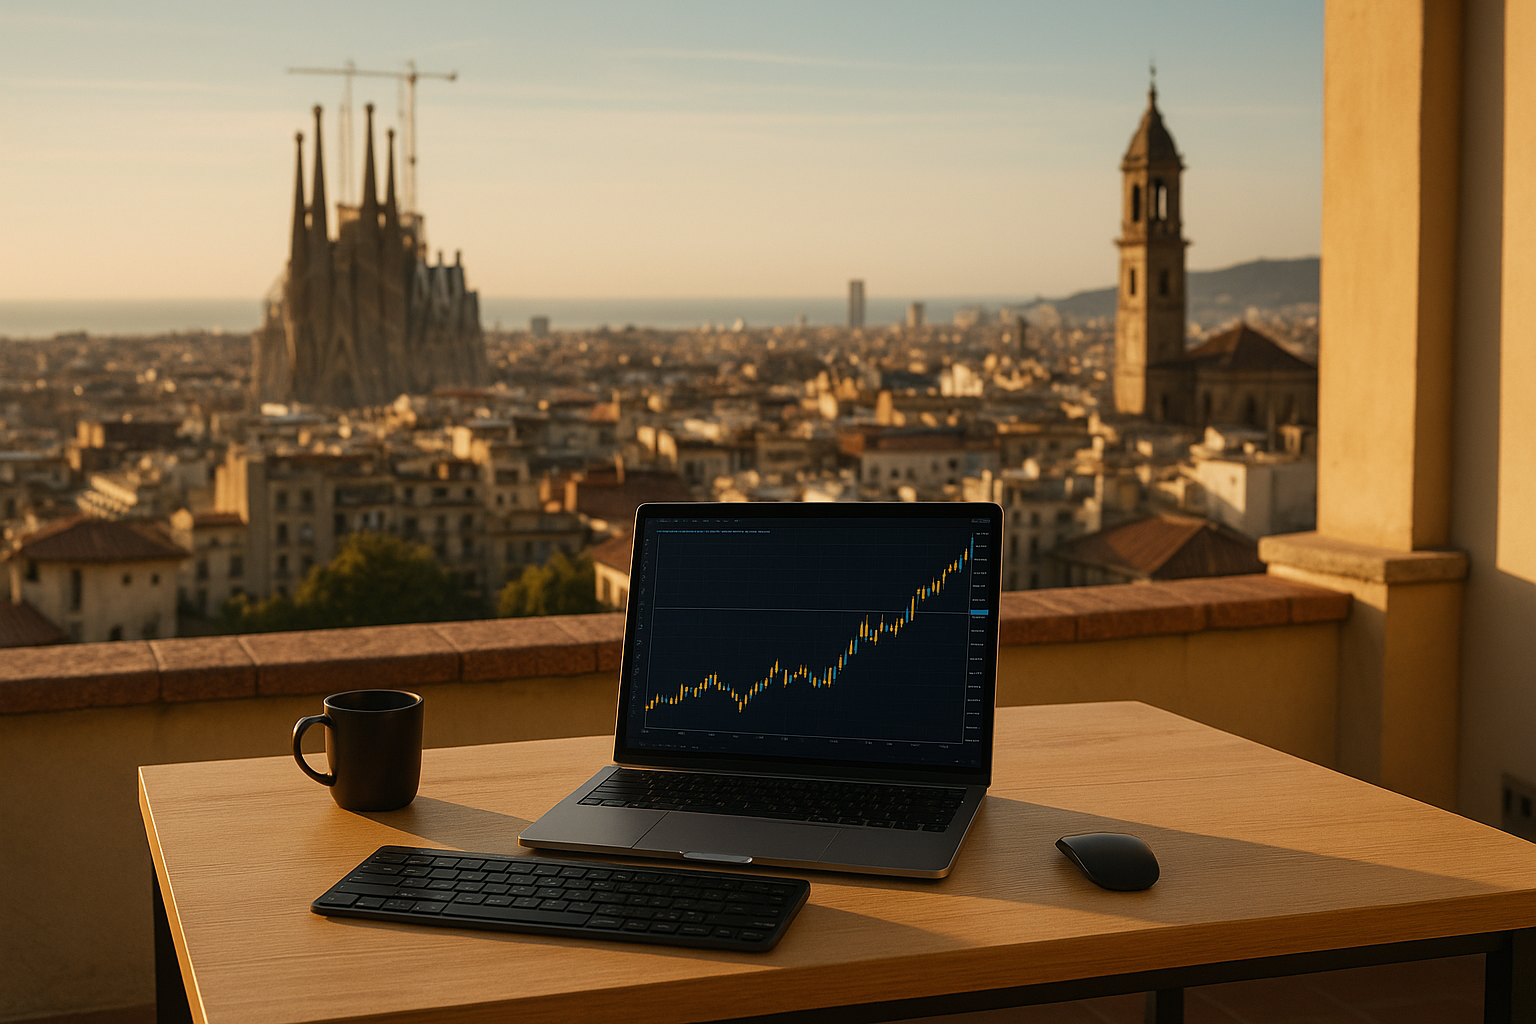
Even now, as I split time between New York City and Barcelona, that connection runs deep.
Barcelona isn’t just in the rearview mirror—it’s still home.
I have a place there. I spend real time there. I have roots, friendships, and a deep sense of belonging.
And yes, I speak Spanish and Catalan like a native—because they’re not just languages to me. They’re a part of who I am-and sometimes I’m doing our YouTube live trading streams from there.
Barcelona shaped my ear for rhythm, my eye for detail, and my appetite for reinvention.
So Why the Name?
Because after everything—the music, the accolades, the media attention, the Harvard case study, the business exits,—I found myself wanting to go back to the start.
Reinventing.
This time not in the music industry, but in the markets.
And once again, I needed something to anchor me.
Not a trading strategy.
Not a dream of freedom – I’m fortunate to already have that.
But a state of mind.
Barcelona is that for me.
It reminds me:
- That creativity and structure can coexist
- That rhythm matters—even when the tempo changes
- That beauty and precision are not opposites
- That no one hands you success, but you can build it (again)
The Barcelona Trader Isn’t a Persona. It’s a Standard.
It’s not about geography.
It’s about identity.
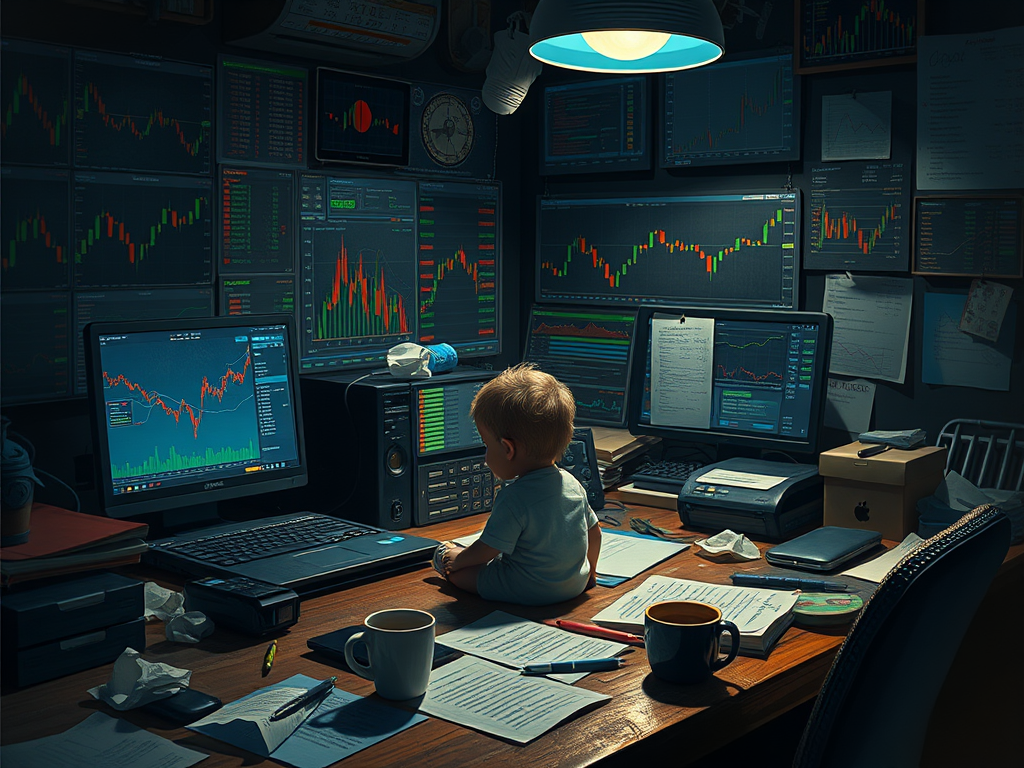
It’s about showing up to the screen every day with the intention to trade like a professional, even when the market is throwing chairs.
It’s about clarity over chaos.
Craft over clickbait.
Discipline over dopamine.
And maybe most importantly—it’s about carrying everything I learned as a creative, as a builder, as a musician, and channeling it into a new frontier that rewards execution over ego.
The Barcelona Trader is who I am when I’m at my best.
And every session, I trade to earn that name all over again.