If you’re new to trading, you’ve probably already been told you “just need to learn candlestick patterns.”
And sure — just like you “just need to go to the gym” to get ripped.
In reality, candlesticks are less about predicting the future and more about reading the emotional wreckage of the recent past.
The Anatomy of a Candlestick
Every candlestick is basically four price points wearing a costume:
- Open – Where price started when that candle began.
- Close – Where price ended when the candle wrapped up.
- High – The highest point price reached during that candle’s life.
- Low – The lowest point price reached.
The body of the candle is the space between the open and close.
The wicks (also called shadows) are the little sticks poking out the top and bottom, showing where price traveled but didn’t stay.
Think of the wicks as “emotional outbursts” — moments when the market got dramatic, then quickly changed its mind.
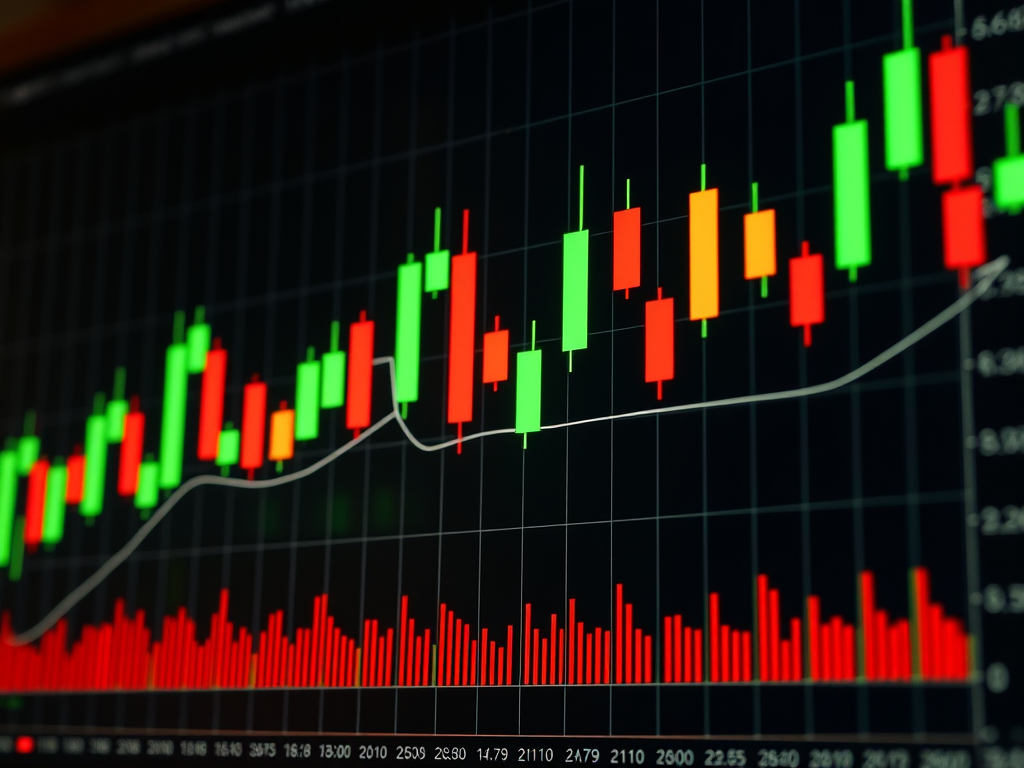
Green (or white) candles usually mean price went up from open to close.
Red (or black) means price went down.
That’s it. No magic — just a price diary.
Timeframes: Same Story, Different Zoom Level
Candles can be set to almost any timeframe.
This changes what each candle represents:
- 10-second candles: Trading on these is like listening to a gossipy friend live-tweet a breakup. You get every emotional micro-spasm — great for scalping, dangerous for your sanity.
- 1-minute candles: Still fast, but you start to see small swings take shape. The trading equivalent of speed dating.
- 5-minute candles: Popular for intraday traders. Big enough to filter noise, small enough to still get multiple entries in a session.
- 15-minute candles: Now you’re watching the market from a slight distance. Less twitchy, but still tradable. Imagine hearing about the fight after the dust has settled, not during the yelling.
The smaller the timeframe, the more noise you’ll see — and the more discipline you’ll need not to chase every wiggle.
Japanese Candlesticks vs. Heiken Ashi
Both are just ways of drawing price action, but they tell the story differently.
Japanese Candlesticks (Regular)
- Each candle reflects the actual open, high, low, and close for that time period.
- They’re brutally honest — no smoothing, no sugarcoating.
- Great for traders who want raw data and can handle mood swings.
Heiken Ashi
- Uses an average of current and previous candles to smooth out the noise.
- A Heiken Ashi candle’s “open” and “close” aren’t the real open and close — they’re calculated.
- Upside: Trends look cleaner, you won’t freak out at every blip.
- Downside: There’s a delay in showing reversals — kind of like a slow friend who only realizes the party’s over after everyone’s gone home.
So Which Should You Use?
- If you’re scalping on a 10-second or 1-minute chart and need every tick of truth? Japanese candlesticks.
- If you want to stay in trends longer and not get whipsawed to death? Heiken Ashi.
- If you’re trying to decide which one’s better overall? That’s like asking whether you should use chopsticks or a fork — depends on what’s on your plate.
Final Word
Candlesticks aren’t magic spells. They’re just the market’s mood swings painted green and red.
If you understand how they work across timeframes — and the difference between raw truth (Japanese) and smoothed story (Heiken Ashi) — you’ve already got an edge over the people still treating them like tarot cards.
Leave a Reply